

energy-charts.info provides a great overview over electricity generation by sector, renewable share and a lot of other data on the German electricity network. They also provide estimates for the next few hours and scenarios how the electricity network could look like in a few decades.
Very unfortunate that they don’t have nuclear power anymore
True, although in recent years nuclear didn’t have a very significant effect on the total energy production anymore as most reactors had already been taken offline. It was just a few percent.
Yeah they just closed their last one down not too long ago. Wish they didn’t do that. Now they’re reliant on fossil fuels

The reliance on fossil fuel didn’t change a lot since shutdown of the last nuclear power plants. And basically… nuclear is also fossil. The fuel rods aren’t just there. They consist of materials which are mined. The difference is only that they are not emitting CO2. But instead the nuclear waste has to be stored for some thousand years. Germany already has a lot of tons of waste and still no place for final storage.
And as we could see last year in France, nuclear isn’t also that much reliable too.
The quitting of nuclear energy was still the right decision. The timing together with the Russian/Ukrainian war wasn’t the best, but unfortunate something like shutting down a nuclear plant ist something you can easily postpone when the plan is planned and startet to execute. Also a bad decision of previous german governments was to shut down nuclear plants and not building up a replacing renewable infrastructure. So in the end, there was no other choice for the current government to shut them down and rely on gas and coal a bit more than they wanted too.

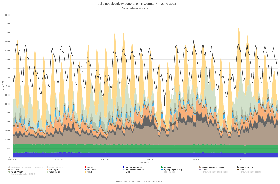
This had me scratching my head for a minute, wondering why there was so much whitespace between the Load curve and the total energy generated. I can’t imagine Germany having nightly rolling blackouts to accommodate a shortfall in generated energy. Then I realized several categories in the legend that are not shown on the chart.
Europe is a fucking big electricity grid. Reaching from (I heard) Marocco through whole of Europe until Turkey. Electricity is all the time imported and exported between the countries.
Here a picture from the current situation. (The color represents the CO2 emissions per kWh produced. As you can see: Poland loves coal.)

