


For people surprised by the UK, here is the 2018 report: https://www.who.int/publications/i/item/9789241565639
It says that the recorder alcohol consumption by percentage was 35.7% wine and 35.0% beer, so a close one.
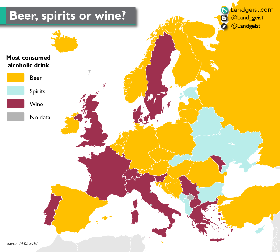
Marking for Slovenia is wrong. I do have statistical data from our statistical agency and it is not even close: 8.5l/person/year of vine and 26.5/person/year of beer (including non-alcohol).
Arguably, vine has higher alcohol content (~11.5%) compared to beer (~4.9%), but even even if we look at “alcohol consumed from wine/beer per person per year”, we get 0,9775L from vine and 1,2985 from beer.
These findings are in agreement with my intuition based on me seeing what people drink.
Thank you for coming to my ted talk.
Source stat.si, year 2018 (latest available): https://pxweb.stat.si:443/SiStatData/sq/23566
As the numbers for beer from stat.si do not differentiate between alcohol free and usual beer, its bold to assume the weighted (by share of consumption) average beer contains 4.9 vol.% alcohol unless you know that it may be totally uncommon to drink non-alcoholic beer.
